The Local Forecast Menu option includes:
|
|
Local Forecasts provide hourly and daily forecasts for 2500 locations. These forecasts are frequently updated to provide you with the latest weather information throughout the day.
The Summary page is available only in the Pavement Forecast,
Transportation, Airport Operations and Alberta editions of MxVision
WeatherSentry Online
|
|
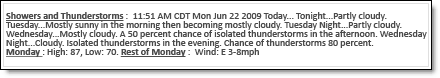
The forecast summary is provided. |
|
|
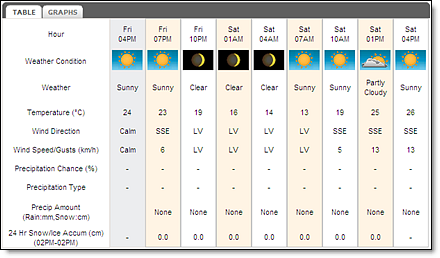
A 24 hour forecast is presented in three hour intervals. One segment of observed data is provided. Move between the Table and Graphs view by clicking the tab. The 24 hours of data provided will also include your threshold parameters. |
|
|
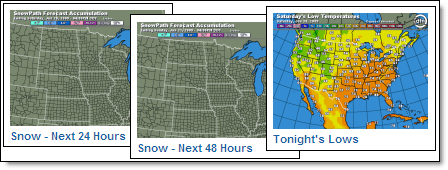
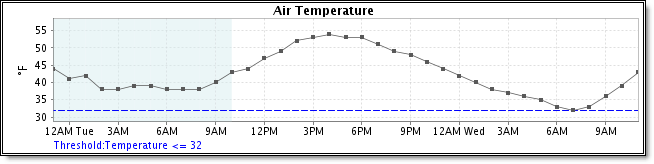
To enlarge one of the graphics, click it with your cursor. Select the Back button to return to the Summary page from the selected graphic. Graphics are only shown in °F. |
The data available in the 15 Day local forecast is determined
by edition. Not all data is available in all editions of MxVision
WeatherSentry Online
The 15 Day forecast provides one day of observed data and fifteen days of forecast data. The first 3 days (72 hours) of the forecast data are updated hourly. The remaining days are updated several times a day. For a more detailed forecast of today's outlook view the Hourly Forecast for your location.
Click the Local Forecast Menu option and select 15 Day.
Select a custom location or use the Map icon.
View the 15 Day forecast and
yesterday's observed data.
The first day of the15 Day forecast provides an outlook for the rest of the day - from this hour forward, rather than the entire midnight to midnight period (which could include past events). This “looking forward only” approach is useful especially when precipitation is in the forecast.
Note: The low and high temperatures of both actual and feels like represent the daily (midnight to midnight) low/high forecast or observation, depending on if the low and/or high have already occurred.

At 7am (shown above) the weather condition showed "All day Snow Likely"
with an accumulation of 7-10 inches.
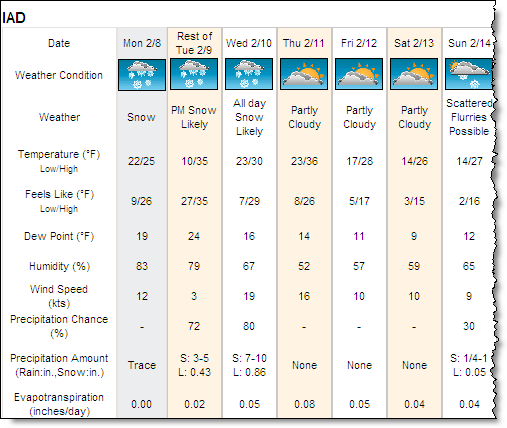
By 4pm (shown above) the weather condition was updated to "PM Snow
Likely" for the Rest of Tuesday. The amount of snow in the forecast
has also been updated. This is because only the amount of precipitation
yet to fall during the Rest of
Tuesday is shown in the graphic. The hourly forecast is available for
a more detailed hour by hour view.
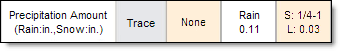
Rain = Rain, depicted in inches (in) or millimeters (mm)
S = Snow, depicted in inches (in) or centimeters (cm)
L = Liquid equivalent of snow, depicted in inches (in) or millimeters (mm)
The hourly forecast includes 12 hours of observed conditions and 72 hours forecast data. The forecast will include your threshold parameters.
Select the Local Forecast Menu option and select Hourly.
Select a custom location or use the Map icon.
View the Hourly forecast and
12 hours of observed data.

In colder months precipitation may fall as snow rather than rain. Precipitation Type includes the characteristic of the snow.
|
|
Wet = Temperature Forecast during the snow event is >
26 degrees F NRM = Temperature Forecast during the snow event is 19-26
degrees F Dry = Temperature Forecast during the snow event is <19
degrees F |
Precip Amount represents the forecast snow
accumulation for a three hour period. Both S (snow total) and L (liquid
total) are provided. If your edition of MxVision WeatherSentry Online
Not all hourly forecast data is available in all editions of MxVision
WeatherSentry Online
RoadCast
Your RoadCast
RoadCast
|
|
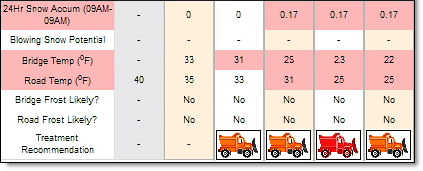
24 Hr Snow Accumulation Blowing Snow Potential Pavement, Runway and Bridge Deck Temperature Pavement, Runway and Bridge Deck Frost Potential Treatment Recommendations from FHWA Customizable Treatment Recommendations Custom atmospheric forecasts for RoadCast locations |
Note: Blowing Snow Potential refers to observed and forecast surface snow which may cause pavement hazards. Snow which is currently falling is not taken into consideration in the Blowing Snow Potential forecast.
Your RoadCast
Select the Local Forecast Menu option.
Click the Hourly submenu option.
Select a RoadCast
Note: When an RWIS site is associated with a RoadCast point,
observed data may also be available in the table. However, not all RoadCast
points are associated with an RWIS site and vice versa.
If road conditions warrant action within the next 24 hour period, an orange snowplow will appear in the Treatment Recommendation row. Click the icon to view the recommendations.
If you have set up multiple treatment plans, select another Treatment Plan from the drop down menu to view those recommendations.
RoadCast
Treatment recommendations include snowplow icons which appear when conditions justify pavement or runway treatment. When the forecast conditions have changed sufficiently to warrant an alteration in treatment recommendations the snowplow icon changes from orange to red. If conditions do not justify pavement or runway treatment no snowplow icon will be shown. Custom Treatment Plans can also be created. Click the snowplow icon to view the treatment recommendations.
Users of the Pavement Forecast, Airport Operations and Alberta editions will receive 12 hours of observed data in addition to the 24 hour forecast.
Graphs will include your threshold parameters.
Select the Local Forecast Menu option and click Graphs.
Select a custom location or use the Map icon.
Check mark the graphs of interest
from Meteogram Settings.
Click Save Settings to save the current meteogram list. The next time you view the graphs the saved list will load with current data.
Note: Blowing Snow Potential refers to observed and forecast surface snow which may cause pavement hazards. Snow which is currently falling is not taken into consideration in the Blowing Snow Potential forecast.
View animated forecasts to better visualize when and where selected weather conditions will occur. Access a variety of weather conditions including precipitation, snow, ice and wind. Animation data is always shown in English units.
Select the Local Forecast Menu option and choose Animations.
Select one of the thumbnails
to view the graphic.
Click the Play icon to view the animation.
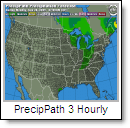
The Path graphics provide an animated picture of snow versus rain versus ice over the next 72 hours. Each frame displays the precipitation in inches expected within the next three hours. Accumulation graphics show the totals expected at the end of the 72 hour period.
![]() MxVision WeatherSentry Online
MxVision WeatherSentry Online