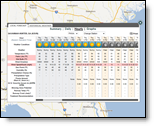
In the Weather Viewer click over your location to view the forecast. Three separate ways to view the same forecast are available; the daily forecast for the next 15 days, the 72 hour forecast shown in hourly format and the 24 hour graph.
|
|
Local Forecasts provide hourly and daily forecasts. These forecasts
are frequently updated to provide you with the latest weather information
throughout the day. Forecast data is provided by the forecast point closest
to your location unless you have purchased custom Site Specific Forecasts
or the RoadCast
The Summary page is available only in the Pavement Forecast,
Transportation, Airport Operations and Alberta editions of MxVision
WeatherSentry Online
Click a location on the layered map.
Select the Local Forecast tab. The forecast summary
is provided.
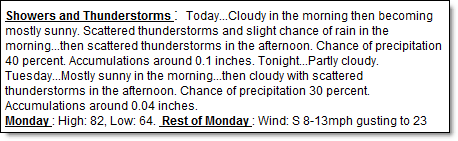
A 24 hour forecast is presented in three hour intervals.
One segment of observed data is provided. The 24 hours of data will also
include your threshold parameter
You may use the drop down menu to change the location.
![]()
Note: The location is changed for this forecast only. Daily,
Hourly and Graphs are each changed separately.
To view one of the graphics, select the link. Note: Graphics are only shown in °F.
![]()
Click the Return To Summary link to go back to the Summary page. Select
Daily, Hourly or Graphs to move to one of those pages.
The data available in the 15 Day local forecast is determined
by edition. Not all data is available in all editions of MxVision
WeatherSentry Online
The 15 Day forecast provides one day of observed data and 15 days of forecast data. The first three days (72 hours) of the forecast data are updated at least once an hour. The remaining 12 days are updated several times a day. For a more detailed forecast of today's outlook view the Hourly Forecast for your location.
Click a location on the layered map.
Select the Local Forecast tab.
Select the Daily link to view the 15 Day forecast and yesterday's observed data.
You may use the drop down menu to change the location.
![]()
Note: The location is changed for this forecast only. Summary,
Hourly and Graphs are each changed separately.
Close the forecast window using the X in the upper right.
The first day of the15 Day forecast provides an outlook for the rest of the day - from this hour forward, rather than the entire midnight to midnight period (which could include past events). This “looking forward only” approach is useful especially when precipitation is in the forecast.
Note: The low and high temperatures of both actual and feels like represent the daily (midnight to midnight) low/high forecast or observation. It will be the observed low and/or high if it has already occurred, and the forecasted low and/or high if it has not yet reached the expected extreme.

At 7am (shown above) the weather condition showed "All day Snow Possible" with an accumulation of 1-3 inches.
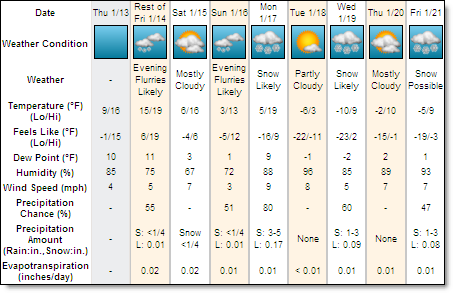
By 4pm (shown above) the weather condition was updated to "Evening Flurries Likely" for the Rest of Friday. The amount of snow in the forecast has also been updated. This is because only the amount of precipitation yet to fall during the Rest of Friday is shown in the graphic. The hourly forecast is available for a more detailed hour by hour view.
|
Condition |
Definition |
|
Date |
The local date (24 hour midnight to midnight) of the forecast. Note: The first day of the15 Day forecast provides an outlook for the rest of the day - from this hour forward, rather than the entire midnight to midnight period. |
|
Weather Condition |
The icon depicting forecast weather conditions. |
|
Weather |
The forecast weather conditions. |
|
Temperature Low |
The lowest temperature forecast within the 24 hour midnight to midnight period. Shown in degrees Fahrenheit or Celsius. Note: When viewing the first day (or Rest of Day) in the forecast table it is possible that the low temperature has already been met and is therefore an observation rather than a forecast. |
|
Temperature High |
The highest temperature forecast within the 24 hour midnight to midnight period. Shown in degrees Fahrenheit or Celsius. Note: When viewing the first day (or Rest of Day) in the forecast table it is possible that the high temperature has already been met and is therefore an observation rather than a forecast. |
|
Feels Like Low |
The coolest Feels Like Temperature expected, in degrees Fahrenheit or Celsius. The current heat index is used if over 70°F (21°C) or wind chill if below 50°F (10°C). Note: When viewing the first day (or Rest of Day) in the forecast table it is possible that the low temperature has already been met and is therefore an observation rather than a forecast. |
|
Feels Like High |
The warmest Feels Like Temperature expected, shown in degrees Fahrenheit or Celsius. The current heat index is used if over 70°F (21°C) or wind chill if below 50°F (10°C). Note: When viewing the first day (or Rest of Day) in the forecast table it is possible that the high temperature has already been met and is therefore an observation rather than a forecast. |
|
Wet Bulb Low |
The lowest Wet Bulb temperature forecast within the 24 hour midnight to midnight period. Available in the Sports, and Turf editions. |
|
Wet Bulb High |
The highest Wet Bulb temperature forecast within the 24 hour midnight to midnight period. Available in the Sports, and Turf editions. |
|
Dew Point |
The absolute temperature at which the air can no longer hold all of its water vapor, causing condensation into liquid water. |
|
Humidity |
The amount of water vapor in the air, shown as a percentage. |
|
Wind Speed |
Wind Speed is indicated in miles per hour (mph) or kilometers per hour (km/h). The Wind Energy Edition may use meters per second (m/s) and the Airport Operations Edition may use knots (kts). |
|
Precip Chance |
The likelihood that precipitation will occur, shown as a percentage. |
|
Precip Amount - Rain |
The amount of rain measured in inches (in) or millimeters (mm) yet to fall in a given 24 hour midnight to midnight period. |
|
Precip Amount - Snow |
S - The amount of snow yet to fall in a given 24 hour midnight to midnight period. Snow is measured in inches (in) or centimeters (cm). |
|
Precip Amount - Liquid |
L - The liquid equivalent of said snow, measured in inches (in) or millimeters (mm). |
|
Evapotranspiration |
The sum of evaporation and plant transpiration from the earth's land surface to atmosphere measured daily. |
The data available in the Hourly forecast is determined
by edition. Not all data is available in all editions of MxVision
WeatherSentry Online
The hourly forecast includes 12 hours of observed conditions and 72 hours of forecast data and is updated at least once an hour. The forecast will include your threshold parameters.
Click a location on the map.
Choose the Local Forecast tab.
Select the Hourly link.
You may use the drop down menu to change the location.
![]()
Note: The location is changed for this forecast only. Summary,
Daily and Graphs are each changed separately.
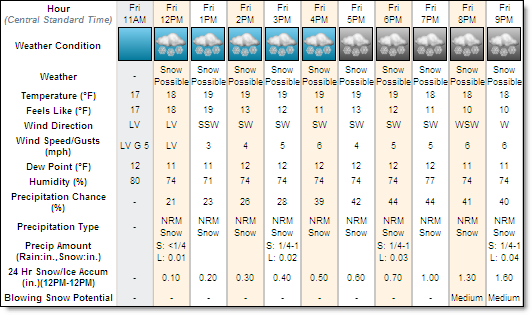
View the Hourly forecast. Use the scroll bar to view
72 hours of forecast data and 12 hours of observed data.
RWIS pavement and bridge deck or runway observed conditions are
also provided for up to the past 12 hours within the Hourly Forecast.
You may turn on the RWIS Obs layer if needed to assist in locating your
RWIS sites.
In colder months precipitation may fall as snow rather than rain. Precipitation Type includes the characteristic of the snow.
|
|
Wet = Temperature Forecast during the snow event is >
26 NRM = Temperature Forecast during the snow event is 19-26
Dry = Temperature Forecast during the snow event is <19
|
Precip Amount represents the forecast snow accumulation for a three
hour period. Both S (snow total) and L (liquid total) are provided. If
your edition of MxVision WeatherSentry Online
Not all hourly atmospheric forecast data is available in all editions
of MxVision WeatherSentry Online
|
Condition |
Definition |
|
Hour |
The local time of the observation. |
|
Weather Condition |
The icon depicting forecast weather conditions. |
|
Weather |
The forecast weather conditions. |
|
Temperature |
Current temperature in degrees Fahrenheit or Celsius. |
|
Feels Like |
Feels Like Temperature in degrees Fahrenheit or Celsius. The current heat index is used if over 70°F (21°C) or wind chill if below 50°F (10°C). |
|
Wet Bulb |
A measure of perceived heat which predicts the likelihood of heat stress. Fahrenheit or Celsius. Available in the Sports, and Turf editions. |
|
Wind Direction |
The Wind Direction indicates the cardinal direction from which the wind originates. |
|
Wind Speed/Gusts |
Wind Speed is indicated in miles per hour (mph) or kilometers per hour (km/h). The Wind Energy Edition may use meters per second (m/s) and the Airport Operations Edition may use knots (kts). |
|
Dew Point |
The absolute temperature at which the air can no longer hold all of its water vapor, causing condensation into liquid water. |
|
Humidity |
The amount of water vapor in the air, shown as a percentage. |
|
Precip Chance |
The likelihood that precipitation will occur, shown as a percentage. |
|
Precip Type |
The type of precipitation expected to occur. When snow is in the forecast it is further diagnosed as Wet, NRM (Normal) or Dry. |
|
Precip Amount - Rain |
The amount of rain measured in inches (in) or millimeters (mm) expected to fall by the end of a three hour period. |
|
|
S - The amount of snow expected to fall by the end of a three hour period. Snow is measured in inches (in) or centimeters (cm). Wet = Temperature Forecast during the snow event is >
26 NRM = Temperature Forecast during the snow event is 19-26
Dry = Temperature Forecast during the snow event is <19
|
|
Precip Amount - Liquid |
L - The liquid equivalent of snow, measured in inches (in) or millimeters (mm). |
|
Expected snow accumulation at the end of each hour as determined by current forecast measured in inches (in) or centimeters (cm). Available for the first 24 hours of the forecast. Available only in the Pavement Forecast Transportation, Airport Operations and Alberta editions. | |
|
Refers to observed and forecast surface snow which may cause pavement hazards. Snow which is currently falling is not taken into consideration. Available only in the Pavement Forecast Transportation, Airport Operations and Alberta editions. |
RoadCast
Your RoadCast
When the layered map is clicked the forecast data from the nearest forecast
point will be loaded. To ensure that you select a RoadCast point, turn
on the RoadCast Forecast layer in the Weather Viewer.
Note: When an RWIS site is near a RoadCast point, observed data
may also be available in the table. However, not all RoadCast points are
associated with an RWIS site and vice versa.
Click a location on the map.
Choose the Local Forecast tab.
Select the Hourly link.
Click on your RoadCast location.
You may use the drop down menus to change the location
and/or the Treatment Plan.
![]()
Note: The location is changed for this forecast only. Summary,
Daily and Graphs are each changed separately.
Select the Hourly forecast link to view the RoadCast
forecast data found within the first 24 hours of data.
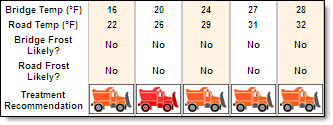
If road conditions warrant action within the next 24 hour period, an orange snowplow will appear in the Treatment Recommendation row. Click the icon to view the recommendations.
If you have set up multiple treatment plans, select another Treatment Plan from the drop down menu to view those recommendations.
RoadCast
Treatment recommendations include snowplow icons which appear when conditions justify pavement or runway treatment. Click the snowplow icon to view the treatment recommendations. When the forecast conditions have changed sufficiently to warrant an alteration in treatment recommendations the snowplow icon changes from orange to red. If conditions do not justify pavement or runway treatment no snowplow icon will be shown. Custom Treatment Plans can be created under the Settings Menu.
|
Condition |
Definition |
|
Bridge Temperature |
Forecast bridge temperature in degrees Fahrenheit or Celsius. Available only in the Pavement Forecast Transportation and Alberta editions. |
|
Road Temperature |
Forecast road temperature in degrees Fahrenheit or Celsius. Available only in the Pavement Forecast Transportation and Alberta editions. |
|
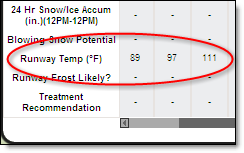
Runway Temperature |
Forecast runway temperature in degrees Fahrenheit or Celsius. Available only in the Airport Operations Edition. |
|
Pavement Condition |
Forecast condition of road surfaces (parameters vary by location). Available only in the Alberta Edition. |
|
Bridge Frost Probability |
Probability for frost on bridge decks (%). Available only in the Pavement Forecast Transportation and Alberta editions. |
|
Road Frost Probability |
Probability for frost on roads (%). Available only in the Pavement Forecast Transportation and Alberta editions. |
|
Runway Frost Probability |
Probability for frost on runways (%). Available only in the Airport Operations Edition. |
|
Treatment recommendations from FHWA |
Industry standard recommendations for the treatment of pavement in adverse weather conditions. |
|
Customizable Treatment Recommendations |
Custom treatment plan for pavement management in adverse weather conditions. |
Users of the Pavement Forecast Transportation, Airport Operations and Alberta editions will receive 12 hours of observed data in addition to the 24 hour forecast.
Graphs will include your threshold parameters.
Click a location on the map.
Choose the Local Forecast tab.
Select the Graphs link.
You may use the drop down menu to change the location.
![]()
Note: The location is changed for this forecast only. Summary,
Daily and Hourly are each changed separately.
Scroll to view all available graphs. Not all graph data
is available in all editions.
To close the graph window click the X in the upper right corner.
|
Parameter |
Edition Available |
Description |
Definition |
|
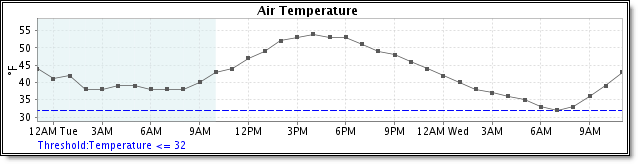
Air Temperature |
All |
Line |
Forecast temperature in degrees Fahrenheit or Celsius. |
|
Wet Bulb Temperature |
Sports and Turf editions |
Line |
Forecast wet bulb temperature in degrees Fahrenheit or Celsius. |
|
Dew Point |
All |
Line |
Forecast dew point temperature in degrees Fahrenheit or Celsius. |
|
Wind Speed / Gusts |
All |
Line |
Forecast sustained wind speed and forecast wind gusts in miles per hour (mph) or kilometers per hour (km/h). Wind depicted in meters per second (m/s) is available in the Wind Energy Edition. Wind depicted in knots (kts) is available in the Airport Operations Edition. |
|
Blowing Snow Potential |
All |
Bar |
Likelihood of blowing snow (low, medium, high). Refers to observed and forecast surface snow which may cause pavement hazards. Snow which is currently falling is not taken into consideration in the Blowing Snow Potential forecast. |
|
Precipitation Probability |
All |
Bar |
Forecast chance of precipitation. |
|
Precipitation Type Probability |
All |
Bar |
Probability of each of the three precipitation types (rain, snow, ice). |
|
Precipitation Amount |
All |
Line |
Forecast amount of precipitation in hundredths of inches (in) or millimeters (mm). |
|
24 Hr Total Snow Accumulation |
All |
Line |
Forecast snow accumulation amount in inches (in) or centimeters (cm). |
|
Road Temperature |
Pavement Forecast Transportation and Alberta editions |
Line |
Forecast road temperature in degrees Fahrenheit or Celsius. |
|
Bridge Deck Temperature |
Pavement Forecast Transportation and Alberta editions |
Line |
Forecast bridge deck temperature in degrees Fahrenheit or Celsius. |
|
Runway Temperature |
Airport Operations Edition |
Line |
Forecast runway temperature in degrees Fahrenheit or Celsius. |
|
Road and Bridge Frost Probability |
Pavement Forecast Transportation and Alberta editions |
Line |
Potential for frost on either bridge decks or roads (%). |
|
Runway Frost Probability |
Airport Operations Edition |
Line |
Potential for frost on runways (%). |
|
Road Temperature and Dew Point |
Pavement Forecast Transportation and Alberta editions |
Line |
Forecast of both road temperature and dew point as separate lines in degrees Fahrenheit or Celsius. Uses threshold for Road Temperature. |
|
Bridge Temperature and Dew Point |
Pavement Forecast Transportation and Alberta editions |
Line |
Forecasts of both bridge deck temperature and dew point as separate lines in degrees Fahrenheit or Celsius. Uses threshold for Bridge Deck Temperature. |
|
Runway Temperature and Dew Point |
Airport Operations Edition |
Line |
Forecast of both runway temperature and dew point as separate lines in degrees Fahrenheit or Celsius. Uses threshold for Runway Temperature. |
![]()