Historical weather provides temperature, precipitation, and degree day information for hundreds of locations across the United States and many more around the world. Data is available back to January 1, 2008. You can view this information to get an idea of what the weather was like on a particular day or during a particular month. This information can be used to indicate which days it rained for construction and turf purposes or snowfall amounts for transportation purposes. The data can be viewed in a daily or monthly format.
|
|
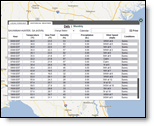
Historical weather data is available for locations around the world. The historical data is taken from the nearest observation station.
Access this historical data by clicking a location on the layered map.
Select the Historical tab within the viewer.
Select either the Daily or Monthly link for the location.
You may choose another location by selecting one of your account locations from the drop down menu, return to the layered map and click over another location or use the Historical Weather Menu option in the left navigation panel.
Two formats for selected locations are available: Daily and Monthly. Switch between the two formats by clicking the Daily or Monthly tab.
The default view is the hour by hour data for the previous day. Change the date by clicking the calendar icon next to the date. Select a different day from the calendar and click Go. Data is available back to January 1, 2008.
|
Available Data |
|
|
Temperature |
Observed air temperature at the selected location. |
|
Dew Point |
Observed dew point at the selected location. |
|
Relative Humidity |
Observed relative humidity at the selected location. |
|
Precipitation |
Amount of measurable precipitation at the selected location. |
|
Wind |
Observed wind direction, speed and gusts at the selected location. |
|
Conditions |
Observed sky conditions at the selected location. |
Daily totals and averages are found at the bottom of the table.
|
Actual Temperature |
|
|
Hi |
The high temperature recorded within a 24 hour period of midnight to midnight local time. |
|
Lo |
The lowest temperature recorded within a 24 hour period of midnight to midnight local time. |
|
Average |
The average temperature calculated using all of the actual temperatures recorded within a 24 hour period of midnight to midnight local time. |
|
Normal Temperature |
|
|
Hi |
The average high temperature calculated using the most recent 30 year period, at the selected location on the selected date. |
|
Lo |
The average low temperature calculated using the most recent 30 year period, at the selected location on the selected date. |
|
Dew Point |
|
|
Hi |
The highest dew point value recorded within a 24 hour period of midnight to midnight local time. |
|
Lo |
The lowest dew point value recorded within a 24 hour period of midnight to midnight local time. |
|
Average |
The average dew point calculated using all of the actual dew point values recorded within a 24 hour period of midnight to midnight local time. |
|
Relative Humidity |
|
|
Hi |
The highest relative humidity value recorded within a 24 hour period of midnight to midnight local time. |
|
Lo |
The lowest relative humidity value recorded within a 24 hour period of midnight to midnight local time. |
|
Average |
The average relative humidity calculated using all of the actual relative humidity values recorded within a 24 hour period of midnight to midnight local time. |
|
Precipitation |
|
|
Liquid Amount |
Total inches of liquid precipitation received within a 24 hour period of midnight to midnight local time. (Includes liquid equivalent of snow) |
|
Snow Accum Est |
Estimation of the total inches of precipitation received as snow within a 24 hour period of midnight to midnight local time. |
|
Wind |
|
|
Hi |
|
|
Average |
|
At the bottom of the Daily Historical table a link is provided to view graphics.
A note on hourly precipitation: not all National Weather Service (NWS), Environment Canada (EC), or other observation stations report hourly precipitation. Some report every 3 hours, some every 6, and some not at all. A - (dash) in the precip column indicates there is no report available, while 0 (zero) indicates the station has reported and there was no precip detected that hour. Further, the stations may accumulate the precip in different ways. Because of these differences, the hourly totals don't necessarily add up to the same amount as reported in the daily value.
|
Symbol |
Definition |
Frequency |
|
- (dash) |
A dash located in the hourly total means no report is available. |
Observation stations do not always use the same methods of data collection or report at the same frequency. Therefore adding up the hourly totals is not always equal to the total daily value. |
|
0 or above |
A numerical value of zero or above represents the total precipitation observed for that hour. |
Due to the inconsistencies with the observation stations, use the hourly precip to get a sense of timing, but use the daily precip value when you want a reliable precip quantity.
Click the Monthly tab to view monthly data. The data for the current month up to the previous day will be listed. View a different month by selecting the month from the Month drop down menu and the year from the Year drop down menu and click Go. Data is available back to January 1, 2008.
|
Actual Temperature |
|
|
Hi |
The high temperature recorded within a 24 hour period of midnight to midnight local time. |
|
Lo |
The lowest temperature recorded within a 24 hour period of midnight to midnight local time. |
|
Normal Temperature |
|
|
Hi |
The average high temperature calculated using the most recent 30 year period, at the selected location on the selected date. |
|
Lo |
The average low temperature calculated using the most recent 30 year period, at the selected location on the selected date. |
|
Departure Max |
The difference between the actual high and the normal high. |
|
Departure Min |
The difference between the actual low and the normal low. |
|
Precipitation |
|
|
Liquid Amount |
Total inches of liquid precipitation received within a 24 hour period of midnight to midnight local time. (Includes liquid equivalent of snow) |
|
Snow Accum Est |
Estimation of the total inches of precipitation received as snow within a 24 hour period of midnight to midnight local time. |
|
Snow Cover Est |
The total inches of snow cover estimated at midnight local time. |
|
Degree Days |
|
|
HDD |
The difference between a reference value of 65°F (18°C) and the average outside temperature for that day. Designed to reflect the demand for energy needed to heat a home or business. |
|
CDD |
The difference between a reference value of 65°F (18°C) and the average outside temperature for that day. Designed to reflect the demand for energy needed to cool a home or business. |
|
Evapotranspiration |
|
|
Evap |
The sum of evaporation and plant transpiration from the earth's land surface to atmosphere measured daily. |
Monthly totals and averages are found at the bottom of the table.
|
Available Data |
|
|
Maximum Temperature |
The highest actual temperature recorded within the selected month at the selected location. |
|
Minimum Temperature |
The lowest actual temperature recorded within the selected month at the selected location. |
|
Average Temperature |
The average temperature calculated using all of the actual temperatures recorded within the selected month at the selected location. |
|
Departure From Normal |
The difference between the average temperature and the average of the normal temperatures during the selected month at the selected location. |
|
Total Heating Degree Days |
The sum of heating degrees required during the selected month at the selected location to maintain an average temperature of 65°F (18°C) within a home or business. |
|
Total Cooling Degree Days |
The sum of cooling degrees required during the selected month at the selected location to maintain an average temperature of 65°F (18°C) within a home or business. |
|
Total Precipitation |
Total inches of liquid precipitation received within the selected month at the selected location. (Includes liquid equivalent of snow) |
|
Normal Precipitation |
The average amount of liquid precipitation calculated over the most recent 30 year period for the selected month at the selected location. |
|
Total Snow Fall |
Estimation of the total inches of precipitation received as snow within the selected month. |
|
Evapotranspiration |
The sum of the daily evapotranspiration during the selected month at the selected location. |
![]()