When your cursor is positioned over any one of the Menus they become visible, however after a period of inactivity the Menus will again become transparent. If you move your cursor off of the function menu it will become transparent more quickly.
|
|
If you are under administrator control your Account Administrator will set the layered map preferences. You are able to change the preferences temporarily, however with each new session (login) all of your Account Administrator preferences will return.
Place your cursor over the map.
While pressing the left mouse button drag the map across your screen.
When you have reached the area of interest release the mouse button.
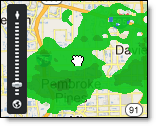
The top of the zoom tool represents local levels and the bottom represents a global view. Several options exist for manipulating the zoom level.
|
|
|
![]()
To expand the map area to full screen, click the expand icon in the upper left corner of the map. You may also press F11 from your keypad to remove your browser menu. Press F11 again to bring your browser menu back.
![]()
When the map is expanded the arrows face inward. Click the arrows to return to the normal view.
There are several layers which may be animated. While viewing satellite, radar or lightning move your cursor over the animation Menu. Click the Play icon to start an animation loop. All animation loops, except Future Radar, start with the oldest frame of data and animate up to the current frame of data. Future Radar begins at the current frame of data and plays a 90 minute loop of forecast data.
Due to the differences in update frequency (and thus stored frames), you will notice that some regions of animated layers appear to animate smoother than others.
![]()
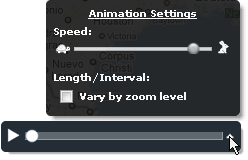
To view one frame of data, grab the animation slider.

To change your animation rate, click the preferences arrow.
Using the Vary by zoom level option will lengthen your animation by lengthening the interval between frames. For example; when viewing a radar loop at the National zoom level with the option turned on you will see a 3 hour loop of radar at 15 minute intervals. Lightning data is the exception. When lightning is animated the full 60 minutes of available data will always play. During animation lightning data is always shown in five minute intervals plus the most current, final frame. To improve performance, while animating, lightning strikes will appear white regardless of age.
|
Layers |
Standard Animation |
|
Satellite |
Six hour loop |
|
Satellite and Radar |
Two hour loop |
|
Satellite and Lightning |
Satellite doesn't animate |
|
Satellite, Radar and Lightning |
Satellite doesn't animate |
|
Radar |
Two hour loop |
|
Radar and Lightning |
One hour loop |
|
Lightning |
One hour loop |
|
Future Radar |
90 minute loop of radar |
|
Future Radar and any other layer(s) |
Other layers don't animate |
This Menu displays the time of the most current radar, lightning or satellite layer visible in the layered viewer.
![]()
To view the time stamps for multiple layers, hover over the settings arrow.
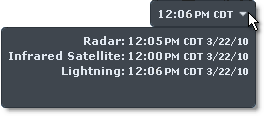
Due to the difference in update frequency, you will notice that the time stamp may vary between the radar, lightning and satellite layers.
|
Regions |
Radar |
Lightning |
Infrared Satellite |
Visible Satellite |
|
US/Alaska/Hawaii/Puerto Rico |
5 Minutes |
1 Minute |
30 Minutes |
30 Minutes |
|
Canada |
10 Minutes |
1 Minute |
30 Minutes |
30 Minutes |
![]()