|
|
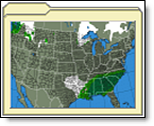
Path graphics are updated three times daily. They provide an animated picture of the predicted precipitation over the next 72 hours, county by county.
Select the Other Forecasts submenu from within the National
Graphics Menu option.
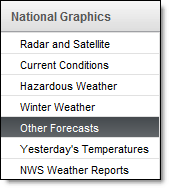
Select the Precipitation Forecast folder.
Review the data. The product may be viewed full screen and can be added to your favorites and slide show. Some graphics can be printed.
The PrecipPath legend includes Light, Moderate and Heavy. Additional details of the legend are provided in both English and Metric units.
|
Rain |
|||
|
Color |
Description |
English |
Metric |
|
|
Light |
< 0.05in |
< 1.27mm |
|
|
Moderate |
0.1in - 0.2in |
2.54mm - 5.08mm |
|
|
Heavy |
> 0.3in |
> 7.62mm |
|
Snow |
|||
|
Color |
Description |
English |
Metric |
|
|
Light |
< 1in |
< 2.5cm |
|
|
Moderate |
1in - 3in |
2.5cm - 7.6cm |
|
|
Heavy |
> 4in |
> 10.2cm |
|
Ice |
|
|
Color |
Description |
|
|
Light |
|
|
Moderate |
|
|
Heavy |
Each frame adds the precipitation expected over the three hour period to the precipitation from the previous frames, accumulating as the animation progresses. On the final frame of the animation you will see the total precipitation accumulation over the 72 hour period.
The path accumulation animations provide a data frame every three hours. Each animation also includes a descriptive legend to assist in interpreting the weather event.
Select the Other Forecasts submenu from within the National
Graphics Menu option.
Select the Temperature Forecast folder.
Review the data. The product may be viewed full screen and can be added to your favorites and slide show. Some graphics can be printed.
Select the Other Forecasts submenu from within the National
Graphics Menu option.
Select the Surface Forecast folder.
Review the data. The product may be viewed full screen and can be added to your favorites and slide show. Some graphics can be printed.
Select the Other Forecasts submenu from within the National
Graphics Menu option.
Select the JetStream Forecast folder.
Review the data. The product may be viewed full screen and can be added to your favorites and slide show. Some graphics can be printed.
TravelCast is available in the Public Safety, Transportation, Pavement Forecast, and Airport Operations editions.
Select the Other Forecasts submenu from within the National
Graphics Menu option.
Select the TravelCast folder.
Review the data. The product may be viewed full screen and can be added to your favorites and slide show. Some graphics can be printed.
The HDD/CDD forecast data is available in the Wind Energy and Utility editions.
Select the Other Forecasts submenu from within the National
Graphics Menu option.
Select the TravelCast folder.
Review the data. The product may be viewed full screen and can be added to your favorites and slide show. Some graphics can be printed.
![]()