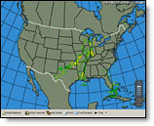
Radar data is updated
about every five minutes, giving you real-time images of the precipitation
you can expect. MxVision WeatherSentry Online
|
|
Radar data provides real-time information on the location, intensity, and movement of precipitation across the United States. The radar indicates where precipitation is occurring and the type of precipitation (rain, mix or snow). All available methods of viewing radar enable you to animate the data, add to Favorites and use in a Slide Show.
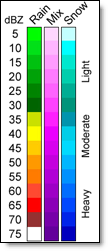
The Schneider Electric composite radar dBZ levels correspond to the NEXRAD standard, however a different color scheme is used.
Using composite radar you can view precipitation over a large area. Also, the affects of attenuation and ground clutter can be removed.
The intensity of a storm cell and the distance from the radar can contribute to the absorption, scattering, or attenuation of the radar beam energy. Any one of these three physical properties may cause a decrease in the apparent storm intensity. With composite radar, storm activity can be simultaneously interrogated from multiple radar sites from different viewing angles and distances. This provides a more complete picture of the entire storm and also substantially reduces the chances of underestimated storm reflectivity levels due to attenuation.
Composite radar is updated every five minutes.
Click the National Graphics Menu option and select Radar
and Satellite.
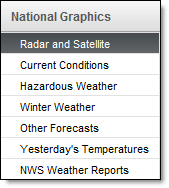
Choose the Radar thumbnail.
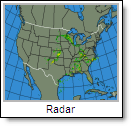
Click over the area of interest with your cursor ![]() or use the zoom and pan tool to zoom to the regional radar.
or use the zoom and pan tool to zoom to the regional radar.
The dbZ levels correspond to the NEXRAD standard, however a different
color scheme is used with the composite radar.
Click the Play icon found in the toolbar to animate the composite radar data. The product may be viewed full screen and can be added to your favorites and/or slide show.
The radar data is produced in two modes: clear air and precipitation. Lighter liquid precipitation and snow are observed in clear air, where the radar scale is adjusted to pick up very light returns. Precipitation mode is used when the rainfall reaches more significant levels. The radar mode is determined either by the radar operator or the radar itself. Base Reflectivity is available for antenna elevation scans of 0.5, 1.5, 2.4, and 3.4 degrees for an area defined by a 124 nautical mile (nm) radius around the site.
NEXRAD radar is updated every five minutes.
Click the National Graphics Menu option and select Radar
and Satellite.
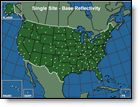
Choose the Single Site - Base Reflectivity thumbnail.
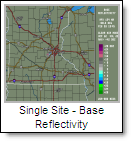
Click the dot representing the NEXRAD radar site of
interest.
Click the Play icon found in the toolbar to animate the NEXRAD radar data. The product may be viewed full screen and can be added to your favorites and/or slide show.
The Storm Mean Velocity is only available in the Public Safety Edition.
Click the National Graphics Menu option and select Radar
and Satellite.
Choose the Single-Site - Storm Mean Velocity thumbnail.
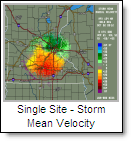
Click the dot representing the NEXRAD radar site of
interest.
Click the Play icon found in the toolbar to animate the NEXRAD radar data. The product may be viewed full screen and can be added to your favorites and/or slide show.
The Storm Mean Velocity is only available in the Public Safety Edition.
Click the National Graphics Menu option and select Radar
and Satellite.
Choose the Single-Site - VAD Wind Profiles thumbnail.
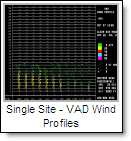
Click the dot representing the NEXRAD radar site of
interest.
Click the Play icon to animate the NEXRAD radar data. The product may be viewed full screen and can be added to your favorites and/or slide show.
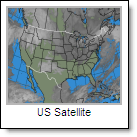
The remapped satellite data results in a stable orientation of the entire image during periods when the satellite moves. In a normal satellite image the data may appear to shift and wander from image to image. An animation of the image would likely show a wobble. Remapping corrects this problem and eliminates the need to change the basemap.
US Satellite data is updated every 30 minutes.
Click the National Graphics Menu option and select Radar
and Satellite.
Choose the Satellite thumbnail.
Click over the area of interest with your cursor ![]() or use the zoom and pan tool to zoom to the regional satellite.
or use the zoom and pan tool to zoom to the regional satellite.
Click the Play icon to animate the satellite data. The product may be viewed full screen and can be added to your favorites and/or slide show.
![]()