Historical weather provides temperature, precipitation, and degree day information for hundreds of locations across the United States back to January 1, 2008. You can view this information to get an idea of what the weather was like on a particular day or during a particular month. This information can be used to indicate which days it rained for construction and turf purposes or snowfall amounts for transportation purposes. The data can be viewed in daily, monthly or graphic formats.
|
|
Historical weather data is available for locations across the United States. The historical data is taken from the nearest observation station for your location. Access this historical data by clicking the Historical Weather Menu option. The historical weather for your default location will appear in daily format. You can choose another location by either selecting one of your account locations from the drop down menu and click Go or by clicking the Map icon. If you select another city using the Map icon the drop down menu will change to a list of all available cities in the selected state. If you leave Historical Weather during the current login session and come back, you will be returned to the last city you viewed.
Two formats for selected locations are available: monthly and daily/hourly. Switch between the two formats by clicking the Daily History or Monthly History submenu option under the Historical Weather Menu option.
|
Actual Temperature |
|
|
Hi |
The high temperature recorded within a 24 hour period of midnight to midnight local time. |
|
Lo |
The lowest temperature recorded within a 24 hour period of midnight to midnight local time. |
|
Normal Temperature |
|
|
Hi |
The average high temperature calculated using the most recent 30 year period, at the selected location on the selected date. |
|
Lo |
The average low temperature calculated using the most recent 30 year period, at the selected location on the selected date. |
|
Departure Max |
The difference between the actual high and the normal high. |
|
Departure Min |
The difference between the actual low and the normal low. |
|
Precipitation |
|
|
Liquid Amount |
Total inches of liquid precipitation received within a 24 hour period of midnight to midnight local time. (Includes liquid equivalent of snow) |
|
Snow Accum Est |
Estimation of the total inches of precipitation received as snow within a 24 hour period of midnight to midnight local time. |
|
Snow Cover Est |
The total inches of snow cover estimated at midnight local time. |
|
Degree Days |
|
|
HDD |
The difference between a reference value of 65°F (18°C) and the average outside temperature for that day. Designed to reflect the demand for energy needed to heat a home or business. |
|
CDD |
The difference between a reference value of 65°F (18°C) and the average outside temperature for that day. Designed to reflect the demand for energy needed to cool a home or business. |
|
Evapotranspiration |
|
|
Evap |
The sum of evaporation and plant transpiration from the earth's land surface to atmosphere measured daily. |
The default view is the daily data for the previous day. The data includes temperature, precipitation, degree days, and the 24-Hour NEXRAD precipitation estimate.
Change the day to view by clicking the calendar icon next to the date in Calendar. Select a different day from the calendar that appears and click Go. Data is available back to January 1, 2008.
Select the Hourly tab to view hourly data. The hourly data is viewed in a table format.
A note on hourly precipitation: not all National Weather Service (NWS) or Environment Canada (EC) observation stations report hourly precipitation. Some report every 3 hours, some every 6, and some not at all. A - (dash) in the precip column indicates there is no report available, while 0 (zero) indicates the station has reported and there was no precip detected that hour. Further, the stations may accumulate the precip in different ways. Because of these differences, the hourly totals don't necessarily add up to the same amount as reported in the daily value.
|
Symbol |
Definition |
Frequency |
|
- (dash) |
A dash located in the hourly total means no report is available. |
Observation stations do not always use the same methods of data collection or report at the same frequency. Therefore adding up the hourly totals is not always equal to the total daily value. |
|
0 or above |
A numerical value of zero or above represents the total precipitation observed for that hour. |
Due to the inconsistencies with the NWS and EC data, use the hourly precip to get a sense of timing, but use the daily precip value when you want a reliable precip quantity.
Click the Monthly History submenu option to view monthly data. The data for the current month up to the previous day will be listed. At the bottom the cumulative totals and average for the month are tracked. Data is available back to January 1, 2008.
|
Monthly Totals |
|
|
Highest Temperature |
The highest actual temperature recorded within the selected month at the selected location. |
|
Lowest Temperature |
The lowest actual temperature recorded within the selected month at the selected location. |
|
Average Temperature |
The average temperature calculated using all of the actual temperatures recorded within the selected month at the selected location. |
|
Departure From Normal |
The difference between the average temperature and the average of the normal temperatures during the selected month at the selected location. |
|
Evapotranspiration |
The sum of the daily evapotranspiration during the selected month at the selected location. |
|
Heating Degree Days |
The sum of heating degrees required during the selected month at the selected location to maintain an average temperature of 65°F (18°C) within a home or business. |
|
Cooling Degree Days |
The sum of cooling degrees required during the selected month at the selected location to maintain an average temperature of 65°F (18°C) within a home or business. |
|
Total Precipitation |
Total inches of liquid precipitation received within the selected month at the selected location. (Includes liquid equivalent of snow) |
|
Total Snow Fall |
Estimation of the total inches of precipitation received as snow within the selected month. |
|
Normal Precipitation |
The average amount of liquid precipitation calculated over the most recent 30 year period for the selected month at the selected location. |
View a different month by selecting the month from the Month drop down menu and the year from the Year drop down menu and click Go. Data is available from the beginning of the prior year.
Historical RWIS data is available in the Pavement Forecast, Airport Operations and Alberta editions.
Historical observations from your RWIS sites can be viewed in either tabular or graphic format. If a value is highlighted with transparent red it has not passed the quality control checks. You may hover over the value for details. Level of service determines length of data availability.
Frequency of observations and available RWIS data will vary from one sensor to another.
|
Historical RWIS Data |
|
|
Time |
Time that data was observed, shown in local time. |
|
Air Temp |
Observed air temperature at the sensor location. |
|
Dew Point |
Observed dew point at the sensor location. |
|
Precip Detection |
Indicates whether or not precipitation is detected. |
|
Barometric Pressure |
Observed barometric pressure at the sensor location. |
|
Wind Direction |
Observed wind direction at the sensor location. |
|
Visibility |
Observed visibility, shown in miles, at the sensor location. |
|
Wind Speed and Gust |
Observed wind speed and gust at the sensor location. |
|
Relative Humidity |
Observed relative humidity at the sensor location. |
|
Precip Accumulation |
Rainfall amount or snowfall liquid equivalent from midnight GMT to present time. |
|
Precipitation Rate |
Amount of precipitation which was falling per hour, measured in inches or millimeters. |
|
Precipitation Intensity |
Observed intensity of precipitation at the sensor location. |
|
Precipitation Type |
The type of precipitation, if any, observed at the sensor location. |
|
Last Precipitation |
The date, start and end time of the last detected precipitation at the sensor location. |
|
Surface Condition |
Observed surface condition of road, runway or bridge at the sensor location. |
|
Road, Runway or Bridge Temp |
Observed temperature of road, runway or bridge surface at the sensor location. |
|
Freeze Temp |
Solution freeze point temperature. |
|
Chemical Saturation |
Percent of chemical saturation in the moisture. |
|
Water Layer Depth |
Current water depth on roadway surface. |
|
Ice Percent |
Percent of ice cover on roadway. |
|
Surface Conductivity |
Conductivity of the ice/liquid mixture on the pavement. |
|
Chemical Percent |
Percent of chemical saturation in the moisture. |
|
Surface Salinity |
Pavement salinity (salt content). |
|
Sub Surface Temp |
Observed temperature at a given distance below the ground surface. |
|
Traffic Speed Min/Max |
Highest/lowest vehicle speed as vehicles travel through traffic zone. |
|
Avg Traffic Speed |
Average vehicle speed as vehicles travel through traffic zone. |
View a different date and/or location using the calendar and the location drop down menu. Click the Go button when selection is made.
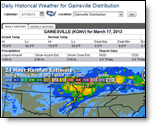
Historical weather can be viewed in graphic format by selecting the Graphics submenu under the Historical Weather Menu option. The graphics are national and do not have the option to select specific locations.
Historical Forecast data is an optional purchase and available only in the Pavement Forecast edition.
The historical forecast data is the actual 36 hour forecast produced for a RoadCast site within the last year. Data is available for a rolling year - meaning that on August 11, 2011, users will be able to view RoadCast forecast data from August 12, 2010 through August 11, 2011. The historical forecast can be saved to a file for further analysis. Only historical forecasts from RoadCast sites pertaining to your account are available. Thresholds and treatment recommendations are not archived with the forecast data and therefore may vary from the settings at the time the forecast was produced. Non RoadCast sites are not available.
![]() MxVision WeatherSentry Online
MxVision WeatherSentry Online