Hover over any of the menus and all of the menus will become visible.
|
|
When your cursor is positioned over any one of the function menus they become visible, however after a period of inactivity the function menus will again become transparent. If you move your cursor off of the function menu it will become transparent more quickly.
If you are under administrator control your Account Administrator will set the layered map preferences. You are able to change the preferences temporarily, however with each new session (login) all of your Account Administrator preferences will return.
|
|
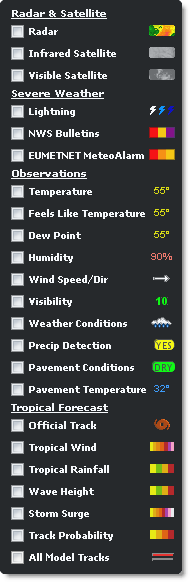
Various layers within two separate sections, map and weather, are available under the Layers Menu. Selected layers are viewed in the content display. Access the layers by moving your cursor over the menu. To view a layer click the check box in front of the layer name. The layer data will be visible in the content display. Click the check box a second time to remove the layer from the display. Not all map layers are available at the same time, this is by design. |
|
Layer |
Description |
|
User Locations |
Custom locations that you or your Account Administrator have created. |
|
Airports |
Airports with runways of greater than 8000 feet. |
|
Forecast Locations |
Location of official forecast stations. |
|
RoadCast Forecasts |
Locations used to produce the RoadCast Forecast. The RoadCast Forecast is included in the first 24 hours of the Hourly forecast table. RoadCast Forecasts are available in the Pavement Forecast Transportation and Airport Operations editions. |
|
Custom Forecast Points |
Custom Forecast Points are used to generate a local forecast. Custom Forecast Points are an optional purchase. |
|
Official Stations |
Location of official surface weather observation sites. Not available at the Global zoom level. |
|
Unofficial Stations |
Location of unofficial surface weather observations from other sources. The capabilities of unofficial observation stations vary and not all stations report all conditions. Not available at the Global zoom level. |
|
RWIS Obs |
Location of observations from the Road Weather Information Systems (RWIS) from participating states. RWIS observation capabilities vary between sensors. Hover over the RWIS marker for data. Available in the Pavement Forecast Transportation, Transportation, Airport Operations, and Alberta editions. |
|
Traffic Speeds |
Color coded traffic conditions including closures, construction, accidents and delays. Available to Platinum users. |
|
Traffic Cameras |
Location of traffic cameras are displayed. Hover over camera icon to view most recent camera image. Update is manual and frequency may vary by camera. Available to Platinum users. |
|
Custom Layers |
Shape file data provided by user. Custom Layers are an optional purchase. |
|
Layer |
Description |
|
Radar |
Current composite radar. Includes colors indicating precipitation type and intensity. Coverage areas, smoothed radar and transparency are adjustable using the preferences arrow within Layer Settings. |
|
Infrared Satellite |
Infrared satellite images are available globally. Transparency of the data can be manipulated using the preferences arrow within Layer Settings. Data can be animated. |
|
Visible Satellite |
Visible satellite images are available globally and updated every 30 minutes. Transparency of the data can be manipulated using the preferences arrow within Layer Settings. Data can be animated. |
|
Layer |
Description |
|
Temperature |
Temperatures for each observation site. Value is color-coded by temperature range. |
|
Feels Like Temperature |
Feels like temperature is listed in degrees Fahrenheit or Celsius. The current heat index is used if over 21°C (70°F) or wind chill if below 10°C (50°F). |
|
Dew Point |
Dew Point for each observation site. The values are color-coded. |
|
Humidity |
Relative humidity for each observation site. Value is color-coded by humidity range. |
|
Wind Speed/Dir |
Arrows indicating the wind direction and speed. The arrows point in the direction the wind is blowing. The color and length of the arrows also indicate speed. |
|
Visibility |
Distance visible at ground level. |
|
Weather Conditions |
Weather or sky condition reported at each observation site. Icons are coded by weather type. |
|
Precip Detection |
Precipitation detection marked as a Yes or No value as reported by RWIS sites having precipitation detection capabilities. Available in the Pavement Forecast, Transportation, Airport Operations, and Alberta editions. |
|
Pavement Conditions |
Pavement conditions as reported by RWIS sites having pavement condition detection capabilities. Available in the Pavement Forecast, Transportation, Airport Operations, and Alberta editions. |
|
Pavement Temperatures |
Pavement temperatures from each RWIS site. Road temperature is shown first then the bridge deck temperature. Values are color-coded. Available in the Pavement Forecast, Transportation, Public Safety, Airport Operations, and Alberta editions. |
|
Layer |
Description |
|
|
Cloud-to-ground and cloud-to-cloud lightning data for a purchased region is depicted by a yellow dotted box. Lightning is color-coded to show age and is updated each minute. Lightning strikes are only visible in your purchased region To view lightning display options hover over the small arrow in the Map Legend. Set the Total Minutes (5 - 60) of data to display. Select ground, cloud or both types of data to view. Age is shown by color. You may also enable the sliding color scale and/or range rings. In the Energy, Wind Energy and Utility editions ground lightning symbols can be set to vary in size by amplitude. |
|
|
While hovering, a summary of all alerts issued by the National Weather Service (NWS) in effect for the county will be listed. Click the county to view the full text of each alert currently in effect. The most severe alert will be listed first (warnings first, then watches, then advisories). If a tornado warning is in effect the counties under the warning will flash. |
|
|
While hovering, a summary of all alarms issued by EUMETNET in effect for the region will be listed. Click the region to view the full text of each alarm currently in effect. The most severe alarm will be listed first (very dangerous first, then dangerous, then potentially dangerous). Available in the Pavement Forecast, Public Safety, Airport Operations, Energy, and Wind Energy Global editions. |
|
Tropical Forecast Layer |
Description |
|
Official Track |
Displays all past positions of the storm. Updated every six hours or more frequently as needed. |
|
Track Probability |
Displays a corridor over both land and water of the probable track of the storm. |
|
Wind Speeds |
Displays a color-coded contoured forecast of wind data values over both land and water areas. |
|
Rainfall |
Displays a color-coded contoured forecast of rain data values over both land and water areas. |
|
Wave Height |
Displays color-coded contoured data values over water areas. |
|
Storm Surge |
Displays color-coded contoured data values over water areas. |
|
Layer |
Description |
|
|
View a time period of up to 24 hours within the last 72 hours. Data can be saved as a CSV file for further analysis. Available in the Energy and Wind Energy editions. |
![]()