The Dashboard is not available in MxVision
WeatherSentry Online
You can conveniently view all of the important weather data pertaining to one of your locations on the Dashboard.
|
|
Select the Dashboard Menu option to access radar, weather monitors, current conditions and forecasts.
Select a location by clicking the drop down menu. All of the data viewed on the Dashboard will pertain to the selected location.
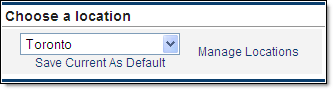
Add and/or edit locations by clicking the Manage Locations link. The Locations page can also be reached via the Settings Menu button.
If desired, set the current location as the default by clicking the Save Current As Default link. The Dashboard will load your default location at each log in. The default location also applies to the daily forecast email.
The Dashboard contains a current radar image of your selected location.
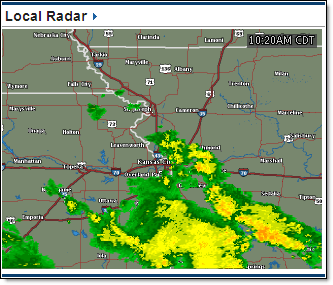
Click over the radar graphic to load the layered map for that area. Navigating
to Local Radar from the Dashboard in this manner replaces the geographic
location previously loaded in the Local Radar page. All other information
such as selected layers, animation state, etc. will remain as it was last
viewed. Here you may zoom in/out, pan, add/remove layers, and animate
data.
This page can also be reached via the Local Radar Menu option. To return to the Dashboard, click the Dashboard Menu option.
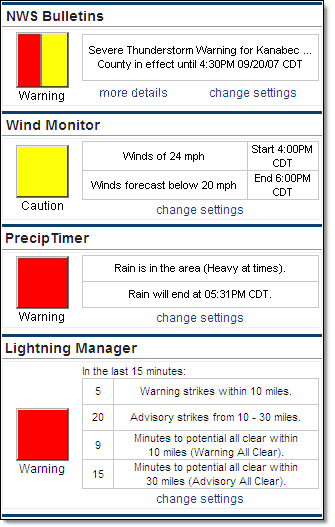
The Dashboard enables you to view the status of the available weather monitors in a graphical display.
|
|
NWS
Bulletins are issued by the National Weather Service. The full text
of the bulletin can be viewed by clicking the More Details link. |
|
WindMonitor | |
|
PrecipTimer | |
|
Lightning Manager® is an optional purchase.
|
Change the settings for the monitor by clicking the appropriate Change Settings link. These pages can also be reached via the Settings Menu button.
|
User Tip: Observed and forecast data will be provided by the surface
observation site closest to your location. However, PrecipTimer
|
Note: If you have purchased
the Lightning Manager
The Dashboard contains current conditions for the selected location.
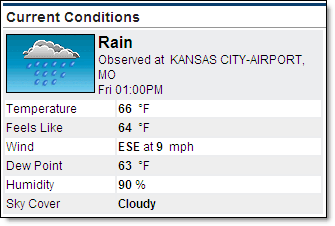
Data is provided from the surface observation site closest to the location:
|
Condition |
Description |
|
Time |
The local time of the observation. |
|
Graphic |
Icon and weather conditions. (The icon is not shown for RWIS locations) |
|
Temperature |
Current temperature in degrees Fahrenheit or Celsius. |
|
Feels Like |
Feels Like Temperature in degrees Fahrenheit or Celsius. The current heat index is used if over 70°F (21°C) or wind chill if below 50°F (10°C). |
|
Wind |
Wind direction and speed. Direction indicates the cardinal direction from which the wind originates. Speed is indicated in miles per hour (mph) or kilometers per hour (km/h). The Wind Energy Edition may use meters per second (m/s) and the Airport Operations Edition may use knots (kts). |
|
Dew Point |
The absolute temperature at which the air can no longer hold all of its water vapor, causing condensation into liquid water. |
|
Humidity |
The amount of water vapor in the air, shown as a percentage. |
|
Sky Cover |
Sky cover depicts the amount of clouds covering the sky. |
|
Road Temp |
The temperature of the road surface as reported by the RWIS location. Available in the Pavement Forecast Transportation Edition. |
|
Bridge Temp |
The temperature of the bridge surface as reported by the RWIS location. Available in the Pavement Forecast Transportation Edition. |
|
Runway Temp |
The temperature of the runway surface as reported by the RWIS location . Available in the Airport Operations Edition. |
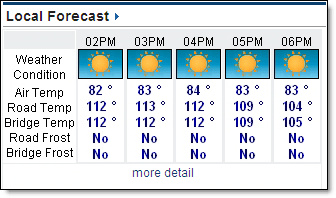
The Hourly and Five Day forecast snapshot is available on the Dashboard.
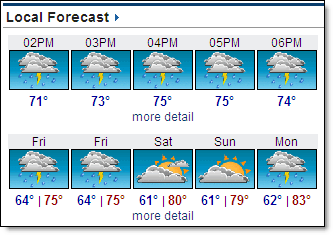
Access the complete Hourly or 15 Day Forecast by clicking the appropriate More Detail link. This data can also be reached via the Local Forecast Menu option.
RoadCast
|
|
RoadCast You must first create locations at the RoadCast
|
![]() MxVision WeatherSentry Online
MxVision WeatherSentry Online