The Dashboard is not available in
MxVision WeatherSentry Online
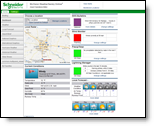
You can conveniently view all of the important weather data pertaining to one of your locations on the Dashboard.
|
|
Select the Dashboard Menu option to access radar, weather monitors, current conditions and forecasts.
Select a location by clicking the drop down menu. All of the data viewed on the Dashboard will pertain to the selected location.
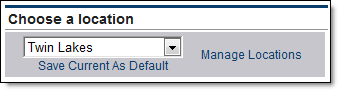
Add and/or edit locations by clicking the Manage Locations link. The Locations page can also be reached via the Settings Menu tab.
If desired, set the current location as the default by clicking the Save Current As Default link. The Dashboard will load your default location at each log in. All locations created will automatically use the alert criteria setting of your default location and the default location also applies to the daily forecast email.
The Dashboard contains a current radar image of your selected location. The time stamp and time zone shown in the radar image is determined by your computer clock.
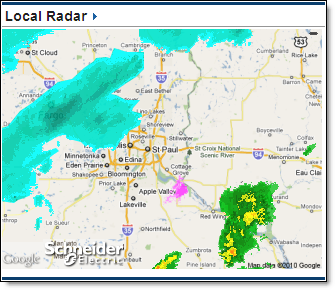
Click over the map to load this area in the Weather Viewer where you may
use layers and animation.
The Dashboard enables you to view the status of the available weather monitors for a selected location. Change the settings for the monitor by clicking the appropriate Change Settings link. These setup pages can also be reached via the Settings Menu tab, within Location Monitoring. Note: Locations do NOT need to be selected in the Location Monitoring pages for viewing in the dashboard monitor.
|
User Tip: Observed and forecast data will be provided by the surface
observation site closest to your location. However, PrecipTimer
|
The NWS Bulletins monitor is available only to locations in the continental US, Alaska, Hawaii, and Puerto Rico.
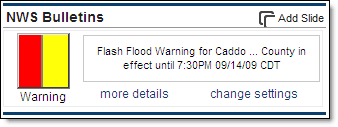
NWS Bulletins are issued by the National Weather Service. The full text of the bulletin can be viewed by clicking the More Details link. The default setting includes all bulletin types. You may change the bulletin types viewed in the dashboard monitor by clicking the Change Settings link or select Location Monitoring located under the Settings Menu. Because the dashboard monitor uses the same settings as the location monitor, both will be updated.
Wind Monitor
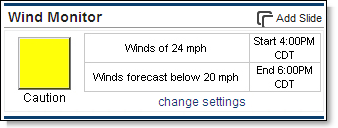
The wind monitor changes color based on the wind forecast. The default setting is a threshold wind speed of 20 miles per hour. You may change the threshold in the dashboard monitor by clicking the Change Settings link or select Location Monitoring located under the Settings Menu. Because the dashboard monitor uses the same settings as the location monitor, both will be updated.
PrecipTimer
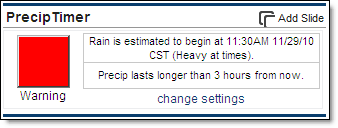
PrecipTimer
Lightning Manager® is an optional purchase. Availability of lightning data is defined by your purchased region.

Lightning Manager
Note: If you have purchased
the Lightning Manager
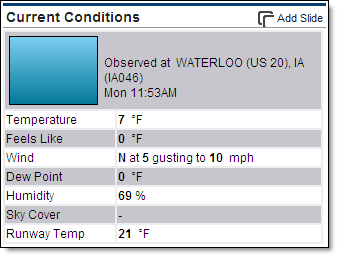
The Dashboard contains current conditions for the selected location.
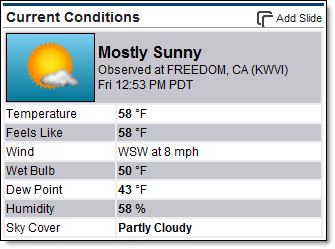
Data is provided from the surface observation site closest to the location. Specific data presented will vary by industry.
|
Condition |
Description |
|
Time |
The local time of the observation. |
|
Graphic |
Icon and weather conditions. (The icon is not shown for RWIS locations) |
|
Temperature |
Current temperature in degrees Fahrenheit or Celsius. |
|
Feels Like |
Feels Like Temperature in degrees Fahrenheit or Celsius. The current heat index is used if over 70°F (21°C) or wind chill if below 50°F (10°C). |
|
Wind |
Wind direction and speed. Direction indicates the cardinal direction from which the wind originates. Speed is indicated in miles per hour (mph) or kilometers per hour (km/h). The Wind Energy Edition may use meters per second (m/s) and the Airport Operations Edition may use knots (kts). |
|
Wet Bulb |
A measure of perceived heat which predicts the likelihood of heat stress. Fahrenheit or Celsius. Available in the Sports, and Turf editions. |
|
Dew Point |
The absolute temperature at which the air can no longer hold all of its water vapor, causing condensation into liquid water. |
|
Humidity |
The amount of water vapor in the air, shown as a percentage. |
|
Sky Cover |
Sky cover depicts the amount of clouds covering the sky. |
|
Road Temp |
The temperature of the road surface as reported by the RWIS location. Available in the Pavement Forecast Transportation Edition. |
|
Bridge Temp |
The temperature of the bridge surface as reported by the RWIS location. Available in the Pavement Forecast Transportation Edition. |
|
Runway Temp |
The temperature of the runway surface as reported by the RWIS location . Available in the Airport Operations Edition. |
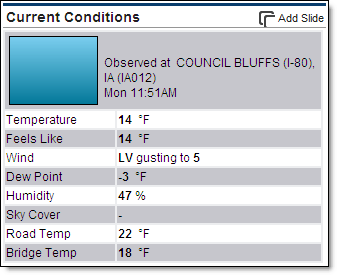
Data is provided from the RWIS site at the location.
|
Condition |
Description |
|
Time |
The local time of the observation. |
|
Graphic |
Icon and weather conditions. (The icon is not shown for RWIS locations) |
|
Temperature |
Current temperature in degrees Fahrenheit or Celsius. |
|
Feels Like |
Feels Like Temperature in degrees Fahrenheit or Celsius. The current heat index is used if over 70°F (21°C) or wind chill if below 50°F (10°C). |
|
Wind |
Wind direction and speed. Direction indicates the cardinal direction from which the wind originates. Speed is indicated in miles per hour (mph) or kilometers per hour (km/h). The Wind Energy Edition may use meters per second (m/s) and the Airport Operations Edition may use knots (kts). |
|
Dew Point |
The absolute temperature at which the air can no longer hold all of its water vapor, causing condensation into liquid water. |
|
Humidity |
The amount of water vapor in the air, shown as a percentage. |
|
Sky Cover |
Sky cover depicts the amount of clouds covering the sky. |
|
Road Temp |
The temperature of the road surface as reported by the RWIS location. Available in the Pavement Forecast Transportation Edition. |
|
Bridge Temp |
The temperature of the bridge surface as reported by the RWIS location. Available in the Pavement Forecast Transportation Edition. |
|
Condition |
Description |
|
Time |
The local time of the observation. |
|
Graphic |
Icon and weather conditions. (The icon is not shown for RWIS locations) |
|
Temperature |
Current temperature in degrees Fahrenheit or Celsius. |
|
Feels Like |
Feels Like Temperature in degrees Fahrenheit or Celsius. The current heat index is used if over 70°F (21°C) or wind chill if below 50°F (10°C). |
|
Wind |
Wind direction and speed. Direction indicates the cardinal direction from which the wind originates. Speed is indicated in miles per hour (mph) or kilometers per hour (km/h). The Wind Energy Edition may use meters per second (m/s) and the Airport Operations Edition may use knots (kts). |
|
Dew Point |
The absolute temperature at which the air can no longer hold all of its water vapor, causing condensation into liquid water. |
|
Humidity |
The amount of water vapor in the air, shown as a percentage. |
|
Sky Cover |
Sky cover depicts the amount of clouds covering the sky. |
|
Runway Temp |
The temperature of the runway surface as reported by the RWIS location . Available in the Airport Operations Edition. |
The Hourly and Five Day forecast snapshot is available on the Dashboard.
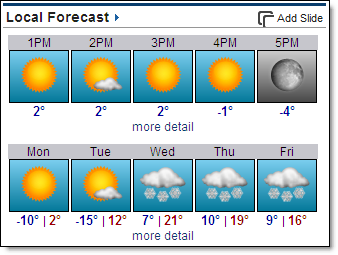
Access the complete Hourly or 15 Day Forecast by clicking the appropriate
More Detail link. This data can also be reached by clicking over the location
in the Weather Viewer.
RoadCast
RoadCast
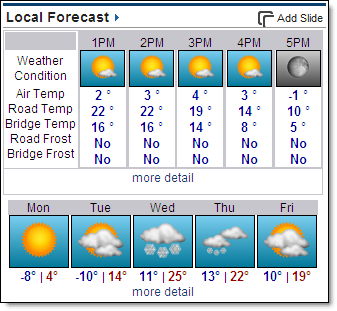
Access the complete Hourly or 15 Day Forecast by clicking the appropriate More Detail link. This data can also be reached by clicking over the location in the Weather Viewer.
|
Condition |
Description |
|
Time |
The forecast hour. |
|
Graphic |
Icon depicting weather condition. |
|
Air Temperature |
Forecast temperature in degrees Fahrenheit or Celsius. |
|
Road Temp |
The forecast temperature of the road surface. Available in the Pavement Forecast Transportation and Alberta editions. |
|
Bridge Temp |
The forecast temperature of the bridge surface. Available in the Pavement Forecast Transportation and Alberta editions. |
|
Road Frost |
Road frost likely, Yes or No. Available in the Pavement Forecast Transportation and Alberta editions. |
|
Bridge Frost |
Bridge frost likely, Yes or No. Available in the Pavement Forecast Transportation and Alberta editions. |
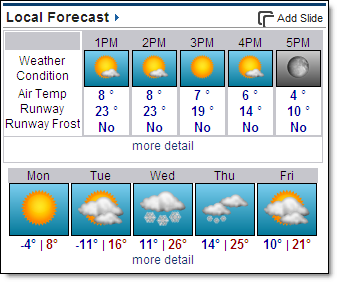
Access the complete Hourly or 15 Day Forecast by clicking the appropriate More Detail link. This data can also be reached by clicking over the location in the Weather Viewer.
|
Condition |
Description |
|
Time |
The forecast hour. |
|
Graphic |
Icon depicting weather condition. |
|
Air Temperature |
Forecast temperature in degrees Fahrenheit or Celsius. |
|
Runway Temp |
The forecast temperature of the runway surface. Available in the Airport Operations Edition. |
|
Runway Frost |
Runway frost likely, Yes or No. Available in the Airport Operations Edition. |
![]()