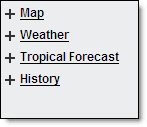
Five separate layer menus are available in Local Radar.
|
|
You can choose to turn layers off and on in order to view only the data of interest. Some layers are not available at every zoom level, this is by design. Some users may have Custom Layers available in addition to those listed.
|
|
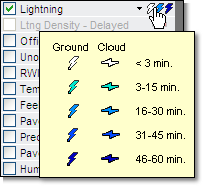
Hover over the symbol in the layer menu to view the legend for that layer. Some layered data is available only in specific editions
of MxVision WeatherSentry Online
|
|
Map Layer |
Description |
|
Cities |
Labeled cities. |
|
User Locations |
Locations that you or your Account Administrator have set up in your account. |
|
Airports |
Larger airports. Labels are available at closer zoom levels. |
|
Interstates |
Interstate highways with labels. |
|
Highways |
Major US and state highways. |
|
Railroads |
Major railroad lines. |
|
County Lines |
County and Parish borders. |
|
County Names |
County and Parish names. |
|
Topography |
Topographic image representing elevation across the United States. |
|
Official Stations |
Location of official surface weather observations from NWS, EC and FAA sites. |
|
Unofficial Stations |
Location of unofficial surface weather observations from other sources. The capabilities of unofficial observation stations vary and not all stations report all conditions. |
|
Location of observations from the Road Weather Information Systems (RWIS) from participating states. RWIS observation capabilities vary between sensors. Available in the Pavement Forecast, Transportation, Airport Operations and Alberta editions. | |
|
NERC Boundaries |
Northern American Electric Reliability Council regional boundaries. Available in the Energy Edition. |
|
IOU Boundaries |
Investor Owned Utilities regional boundaries. Available in the Energy Edition. |
|
Co-op Boundaries |
Cooperative regional boundaries. Available in the Energy Edition. |
|
Municipal Boundaries |
Municipal regional boundaries. Available in the Energy Edition. |
|
Transmission Lines |
Transmission Lines. Available in the Energy Edition. |
|
Weather Layer |
Description |
|
Radar (US) |
Current composite radar. Includes colors indicating precipitation type and intensity. Can be animated. Images are updated every 5 minutes. Due to the difference in update frequency you may see one additional US radar frame when animated with Canadian radar. |
|
Future Radar (US) |
Forecast of radar trends across the US. Animates in 5 minute intervals. |
|
Forecast path of strong to severe storms which are color-coded to indicate the type of storm activity. Storm corridors which contain a tornadic vortex signature (TVS) will flash. Some Canadian locations located within the footprint of US radar may be capable of receiving storm corridors generated via US radar data. | |
|
Radar (Canadian) |
Composite radar image is updated every 10 minutes. A dotted line defining the extent of the Canadian radar is visible within the layer. The radar can be animated. |
|
Infrared Satellite |
Infrared satellite images are updated every 30 minutes and can be animated. |
|
Visible Satellite |
Current visible satellite image. Satellite images are updated every 30 minutes. |
|
Cloud-to-ground and cloud-to-cloud lightning data for a selected region is depicted by a yellow dotted box. Lightning is color-coded to depict age and is updated each minute. Due to the difference in update frequency you may see one additional lightning frame when animated with radar. | |
|
In the Energy, Wind Energy and Utility editions ground lightning symbols can be set to vary in size by amplitude. | |
|
US Lightning Density - Delayed |
The lightning shown in this layer is delayed 15 minutes and can be used to get a general view of lightning activity. It should not be used for making safety decisions. The layer is only available in the full US and regional zoom levels. |
|
While hovering a summary of all alerts issued by the National Weather Service (NWS) in effect for the county will be listed. Click the county to view the full text of each alert currently in effect. The most severe alert will be listed first (warnings first, then watches, then advisories).All counties and marine zones affected by current National Weather Service warnings are shaded red, and will flash if a Tornado warning has been issued. The Area of Maximum Impact (AMI) is included. | |
|
Temperature |
Temperatures for each observation site (both official and unofficial). Value is color-coded by temperature range. |
|
Feels Like Temperature |
Feels like temperature is listed in degrees Fahrenheit or Celsius. The current heat index is used if over 70°F (21°C) or wind chill if below 50°F (10°C). |
|
Dew Point |
Dew Point for each observation site. The values are color-coded. |
|
Humidity |
Relative humidity for each observation site (both official and unofficial). Value is color-coded by humidity range. |
|
Wind Speed/Dir |
Arrows indicating the wind direction and speed. The arrows point in the direction the wind is blowing. The color and length of the arrows also indicate speed. |
|
Weather Conditions |
Weather or sky condition reported at each observation site (official or unofficial). Icons are coded by weather type. |
|
RWIS Camera Images
|
Photos of the RWIS location taken approximately every 20 minutes. Use the Get Details function to view the most current nine images. Click the camera icon to select additional cameras where available. RWIS camera images are an optional purchase. |
|
Precip Detection
|
Precipitation detection marked as a Yes or No value as reported by RWIS sites having precipitation detection capabilities. Available in the Pavement Forecast, Transportation, Airport Operations and Alberta editions. |
|
Pavement Conditions |
Pavement conditions as reported by RWIS sites having pavement condition detection capabilities. Available in the Pavement Forecast, Transportation, Airport Operations and Alberta editions. |
|
Pavement/Runway Temperature |
Pavement temperatures from each RWIS site. Road temperature is shown first then the bridge deck temperature. Values are color-coded. Available in the Pavement Forecast, Transportation, Public Safety, Airport Operations and Alberta editions. |
|
Temperature 50 cm |
The temperature detected 50 cm below the surface by the RWIS sensor. Available only in the Alberta Edition. |
|
Temperature 150 cm |
The temperature detected 150 cm below the surface by the RWIS sensor. Available only in the Alberta Edition. |
|
Tropical Forecast Layer |
Description |
|
Official Track |
Displays all past positions of the storm. Updated every six hours or more frequently as needed. |
|
Track Probability |
Displays a corridor over both land and water of the probable track of the storm. |
|
Wind Speeds |
Displays a color-coded contoured forecast of wind data values over both land and water areas. |
|
Rainfall |
Displays a color-coded contoured forecast of rain data values over both land and water areas. |
|
Wave Height |
Displays color-coded contoured data values over water areas. |
|
Storm Surge |
Displays color-coded contoured data values over water areas. |
|
History Layer |
Description |
|
View a time period of up to 24 hours within the last 72 hours. Data can be saved as a CSV file for further analysis. Available in the Energy, Wind Energy and Utility editions. | |
|
Historical Storm Corridors display US storm forecast path data from the last seven days. Up to 24 hours may be displayed at one time. Customize your parameters in the Storm Display options menu. | |
|
Displays up to 24 hours of US local storm reports within the last seven days. Set your parameters in the Storm Display options menu. | |
|
Past 1 Hour Rain, Estimate |
Past 1 hour estimated rainfall (or liquid equivalent, if snow). Updated hourly. |
|
Past 3 Hour Rain, Estimate |
Past 3 hours estimated rainfall (or liquid equivalent, if snow). Updated hourly. |
|
Today's Rain so far, Estimate |
Today's estimated rainfall so far (or liquid equivalent, if snow). Amount since 6am CST (12 GMT). Updated hourly. |
|
Yesterday/Overnight Rain |
24 hour rainfall (or liquid equivalent, if snow). Updated twice daily at 1am CST and 5am CST (7 GMT and 11 GMT). Note: Estimates are updated with ground observations at mid-day, reflecting actual totals as of 6am CST yesterday to 6am CST today (12 GMT yesterday to 12 GMT today). |
|
Past 7 Days Rain |
Past 7 days actual rainfall (or liquid equivalent, if snow). Updated at 6am CST (12 GMT) daily. |
|
Past 30 Days Rain |
Past 30 days actual rainfall (or liquid equivalent, if snow). Updated at 6am CST (12 GMT) daily. |
![]() MxVision WeatherSentry Online
MxVision WeatherSentry Online